Case Study 02
Case Study 02
Helping o9 Platform to transform into an absolute PaaS by integrating self-diagnostic and self-healing capabilities.
Helping o9 Platform to transform into an absolute PaaS by integrating self-diagnostic and self-healing capabilities.
Industry
Industry
B2B (Supply Chain)
B2B (Supply Chain)
Company
Company
o9Solutions
o9Solutions
Timeline
Timeline
4 Weeks
4 Weeks
Highlights
Highlights


My Deliverables
Information architecture (IA)
Designing for the web
Creative direction
Documentation UX testing
Designing for accessibility
Tools Used
Figma, Sketch, Docs, Paper & pen
My Team
Shobhna: UX Designer I
Mayuri Mukherjee: Sr. Product Manager
Prashant Jhaba: Sr. Software Engineer
Hema Kumari: Sr. QA Analyst
UX Team and rest of the Team at o9!
Problem statement
Problem Statement
Problem Statement
Why Platform Health Report is needed?
Why Platform Health Report is needed?
Why Platform Health Report is needed?
Limited Insight into Component Health
The existing Platform Health Monitoring Service provides only basic metrics such as heartbeats & resource usage, resulting in a lack of comprehensive understanding of the overall health of platform components.
The existing Platform Health Monitoring Service provides only basic metrics such as heartbeats & resource usage, resulting in a lack of comprehensive understanding of the overall health of platform components.
Inefficiency in Problem Identification
Due to the absence of detailed health reports, users face challenges in accurately identifying and addressing potential issues within platform components, leading to inefficiencies in problem resolution and system maintenance.
Due to the absence of detailed health reports, users face challenges in accurately identifying and addressing potential issues within platform components, leading to inefficiencies in problem resolution and system maintenance.
Lack of User-Friendly Monitoring Tools
Without a high-level dashboard and detailed component-specific dashboards, users are unable to easily visualize the check status of all components and access detailed information, hindering their ability to effectively monitor and manage platform health.
Without a high-level dashboard and detailed component-specific dashboards, users are unable to easily visualize the check status of all components and access detailed information, hindering their ability to effectively monitor and manage platform health.
Vision
Vision
Goals
Autonomous Platform Diagnostics and Health Optimization
In today’s fast-paced digital landscape, ensuring platform reliability and uptime is critical. The vision is to create a self-sustaining, intelligent platform capable of autonomously assessing, diagnosing, and optimizing its environment. This system will not only reduce downtime but also enhance the user experience by proactively identifying and addressing issues in real-time.
In today’s fast-paced digital landscape, ensuring platform reliability and uptime is critical. The vision is to create a self-sustaining, intelligent platform capable of autonomously assessing, diagnosing, and optimizing its environment. This system will not only reduce downtime but also enhance the user experience by proactively identifying and addressing issues in real-time.
Goals
Self-Discovery
Enable the platform to autonomously identify & evaluate its component's performance, ensuring comprehensive coverage and accurate diagnosis.
Enable the platform to autonomously identify and assess its components, ensuring comprehensive coverage & accurate diagnosis.
Centralized Dashboard
Establish a centralized dashboard providing a holistic view of the platform environment. This dashboard will allow users to quickly assess the health of various components and identify any potential issues.
Environment Health Validation
Implement automated validation mechanisms to continuously monitor the health of platform environments. This will proactively identify and address any anomalies or potential issues, minimizing downtime and improving overall reliability.
Reduced Troubleshooting Efforts
Streamline troubleshooting efforts by leveraging self-diagnostic capabilities to identify and resolve issues in real-time. This will reduce manual intervention and accelerate problem resolution, enhancing user experience and platform reliability.
Streamline troubleshooting efforts by leveraging self-diagnostic capabilities to identify & resolve issues in real-time. This reduces manual intervention & accelerates problem resolution, enhancing user experience and platform reliability.
Environment Health Validation
Implement automated validation mechanisms to continuously monitor the health of platform environments. This will proactively identify and address any anomalies or potential issues, minimizing downtime and improving overall reliability.
Self-Discovery
Enable the platform to autonomously identify and assess its components, ensuring comprehensive coverage & accurate diagnosis.
Centralized Platform Environment Dashboard
Establish a centralized dashboard providing a holistic view of the platform environment. This dashboard will allow users to quickly assess the health of various components and identify any potential issues.
Environment Health Validation
Implement automated validation mechanisms to continuously monitor the health of platform environments. This will proactively identify and address any anomalies or potential issues, minimizing downtime and improving overall reliability.
Reduced Troubleshooting Efforts
Streamline troubleshooting efforts by leveraging self-diagnostic capabilities to identify & resolve issues in real-time. This reduces manual intervention & accelerates problem resolution, enhancing user experience and platform reliability.
Insights, users and use-cases
Insights, users and use-cases
As the designer for the project, I collaborated with Mayuri (Senior Product Manager), who helped structure the questionnaire for the primary research. Starting in 2022, she gathered survey feedback from 120 participants across various other departments within the organization. I reviewed the survey findings and created user personas and use cases to advance the process.
As the designer for the project, I collaborated with Mayuri (Senior Product Manager), who helped structure the questionnaire for the primary research. Starting in 2022, she gathered survey feedback from 120 participants across various other departments within the organization. I reviewed the survey findings and created user personas and use cases to advance the process.
92%
It is critical in enabling users to monitor the health of the environments, swiftly diagnose issues & maintain overall system stability and reliability.
Participants wanted 'system health data access'
>87%
Agreed that there is
Lack of visibility
42%
Environment
System Admin
35%
Project Team
Members
23%
Executives
The three major categories emerged from the participants of cross-functional departments helped in creation of focused personas later on.
>65%
Users got affected by delayed information about the environment diagnosis & resolution
Component-specific insights
76%
Users agreed to the importance in allowing users to quickly identify & resolve issues. To ensures smooth project progress and identify & resolves issues quickly.
>84%
Post-upgrade stability check
This will ensure system updates do not disrupt operations, enabling system administrators to maintain reliability and quickly address any arising issues.
21%
Not configured
68%
Component related
11%
No response
Type of issues
Issues that are responsible for the downtime
>56%
Agreed that downtime affects
Productivity

Persona 1
Organisation
o9Solutions Inc.
Team
Sales & Consulting
Role
Executive
Needs
Rapid assessment of the environment's overall health to ensure smooth business operations.
Gauge the environment's status quickly without delving into intricate technical details.
Reliable data to support decision-making processes.
Notifications of critical issues to prevent disruptions.
High-level summaries that align with business goals and KPIs.
Wants
A concise, high-level overview of the environment's performance to make informed strategic decisions efficiently.
Key metrics and indicators are presented in an easily digestible format.
Visual dashboards with customizable views for different business aspects.
Automated reports are delivered at regular intervals.
Quick access to historical data for trend analysis.
Pain-points
Overwhelming technical details that are not relevant to their role.
Delayed information leading to uninformed decision-making.
Lack of clarity in reports and data presentations.
Inconsistency in the metrics reported.
Difficulty in correlating technical issues with business impact.
Persona 1
Organisation
o9Solutions Inc.
Team
Consulatation
Role
Executive
Needs
Rapid assessment of the environment's overall health to ensure smooth business operations.
Gauge the environment's status quickly without delving into intricate technical details.
Reliable data to support decision-making processes.
Notifications of critical issues to prevent disruptions.
High-level summaries that align with business goals and KPIs.
Wants
A concise, high-level overview of the environment's performance to make informed strategic decisions efficiently.
Key metrics and indicators are presented in an easily digestible format.
Visual dashboards with customizable views for different business aspects.
Automated reports are delivered at regular intervals.
Quick access to historical data for trend analysis.
Pain-points
Overwhelming technical details that are not relevant to their role.
Delayed information leading to uninformed decision-making.
Lack of clarity in reports and data presentations.
Inconsistency in the metrics reported.
Difficulty in correlating technical issues with business impact.
92%
It is critical in enabling users to monitor the health of the environments, swiftly diagnose issues & maintain overall system stability and reliability.
Participants wanted 'system health data access'
>80
Agreed that there is
Lack of visibility
42%
Environment
System Admin
35%
Project Manger
23%
Executives
The categorization and number of participants involved in the survey facilitated the creation of focused personas later on.
>65
Users got affected by delayed information about the environment diagnosis & resolution
Component-specific insights
76%
Users agreed to the importance in allowing users to quickly identify & resolve issues. To ensures smooth project progress and identify & resolves issues quickly.
>57
Post-upgrade stability check
This will ensure system updates do not disrupt operations, enabling system administrators to maintain reliability and quickly address any arising issues.
23%
Executives
37%
Environment Admins
22%
Devops Team
13%
Development Team
5%
Project Team
User type response
Total number of user responses received across cross-functional departments
Information Architecture
Information Architecture
Workspace
Navigation
Designer
Workspace
Model Library
Workspace
Platform Health
Report Workspace
Integration
Workspace
Demand Planing
Workspace
Tenants
Workspace
My Views
Workspace
Dashboard
Health KPI
Charts
KPI Tiles
Health List View
All environments
All Tenants
All components
Status
Filter/Sort
View more details
Actions
Enlarge view
Download List
Actions
Global search
Global filter
Filter by Tenant
Single
Multiple
Filter by Environment
Single
Multiple
Filter by Timestamp
Start Date Time
End Date Time
Filter by Status
Healthy
Unhealthy
No Response
Not Configured

Persona 1
Organisation
o9Solutions Inc.
Team
Executive
Role
Executive
Needs
Rapid assessment of the environment's overall health to ensure smooth business operations.
Gauge the environment's status quickly without delving into intricate technical details.
Reliable data to support decision-making processes.
Notifications of critical issues to prevent disruptions.
High-level summaries that align with business goals and KPIs.
Wants
A concise, high-level overview of the environment's performance to make informed strategic decisions efficiently.
Key metrics and indicators are presented in an easily digestible format.
Visual dashboards with customizable views for different business aspects.
Automated reports are delivered at regular intervals.
Quick access to historical data for trend analysis.
Pain-points
Overwhelming technical details that are not relevant to their role.
Delayed information leading to uninformed decision-making.
Lack of clarity in reports and data presentations.
Inconsistency in the metrics reported.
Difficulty in correlating technical issues with business impact.

Persona 2
Organisation
o9Solutions Inc.
Team
R&D
Role
Environment Admin
Needs
Detailed information post-upgrades or downgrades to verify the environment's stability.
Access to comprehensive data on system health and component status.
Real-time monitoring of system performance.
Tools for diagnosing and troubleshooting issues quickly.
Historical data for identifying recurring problems.
Wants
Comprehensive insights into system health and precise diagnostics to identify problematic components quickly.
Explanations or reasons behind any detected issues to address root causes effectively.
Customizable alerts for different types of system anomalies.
Detailed logs and reports for audit and compliance purposes.
Integration with existing monitoring tools for a unified view.
Pain-points
Inability to diagnose issues swiftly due to insufficient data.
Lack of visibility into specific component performance.
Difficulty in accessing historical data for problem analysis.
Inadequate explanations for detected issues.
Time-consuming manual troubleshooting processes.

Persona 3
Organisation
o9Solutions Inc.
Team
Project Team
Role
Team Member
Needs
Verify the functionality of their assigned areas and quickly identify any issues.
Specific insights into the health status of components relevant to their projects.
Real-time updates on project-specific metrics.
Access to component-specific data to ensure project success.
Collaboration tools for team communication and issue resolution.
Wants
Tailored insights into the health status of specific components related to their projects.
Intuitive visualization of data to easily track project-related metrics and dependencies.
Automated alerts for issues within their scope of responsibility.
Detailed reports on component performance impacting their projects.
Easy access to data for status meetings and reporting.
Pain-points
Difficulty in isolating issues relevant to their projects.
Overwhelming amount of irrelevant data.
Lack of real-time updates on component health.
Inconsistent reporting affecting project timelines.
Communication gaps within the team due to insufficient collaboration tools
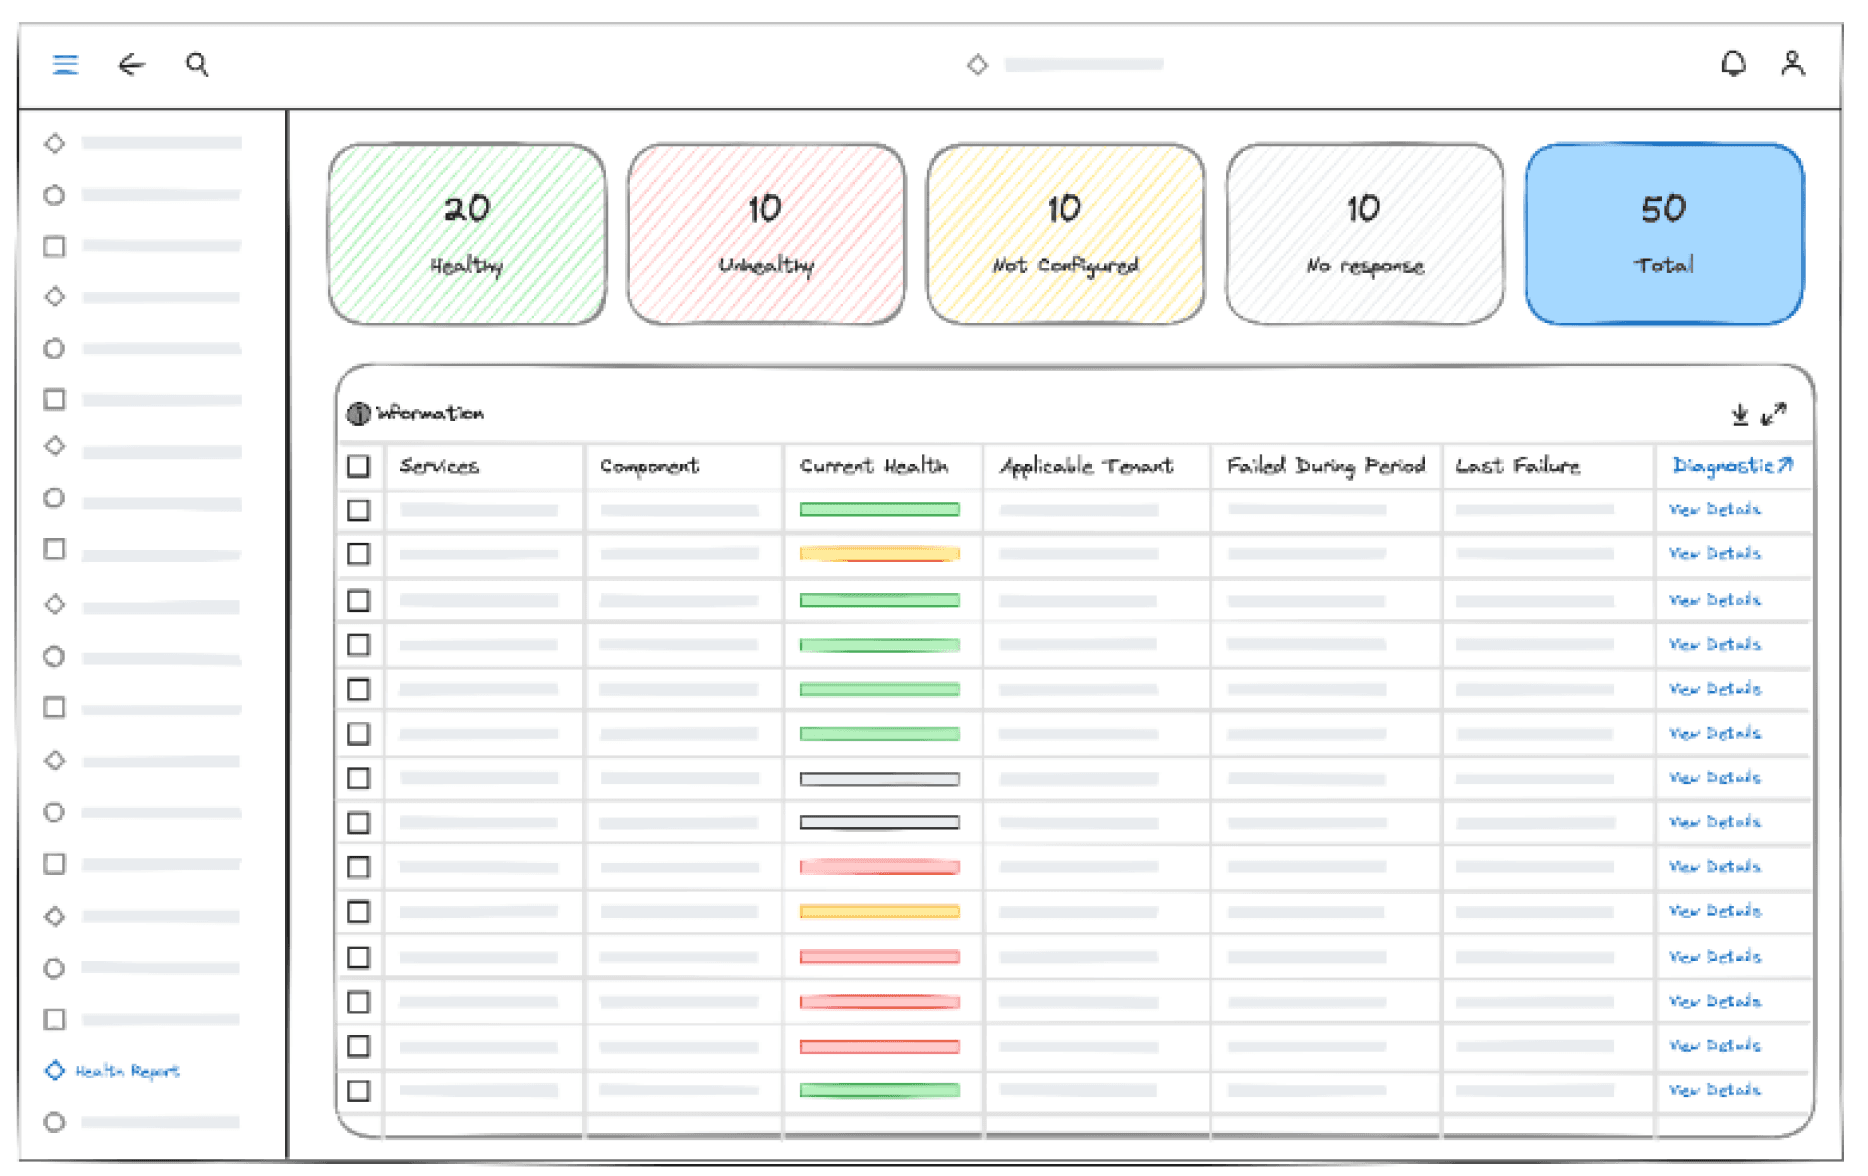
Lo-fi Wireframes
Lo-fi Wireframes

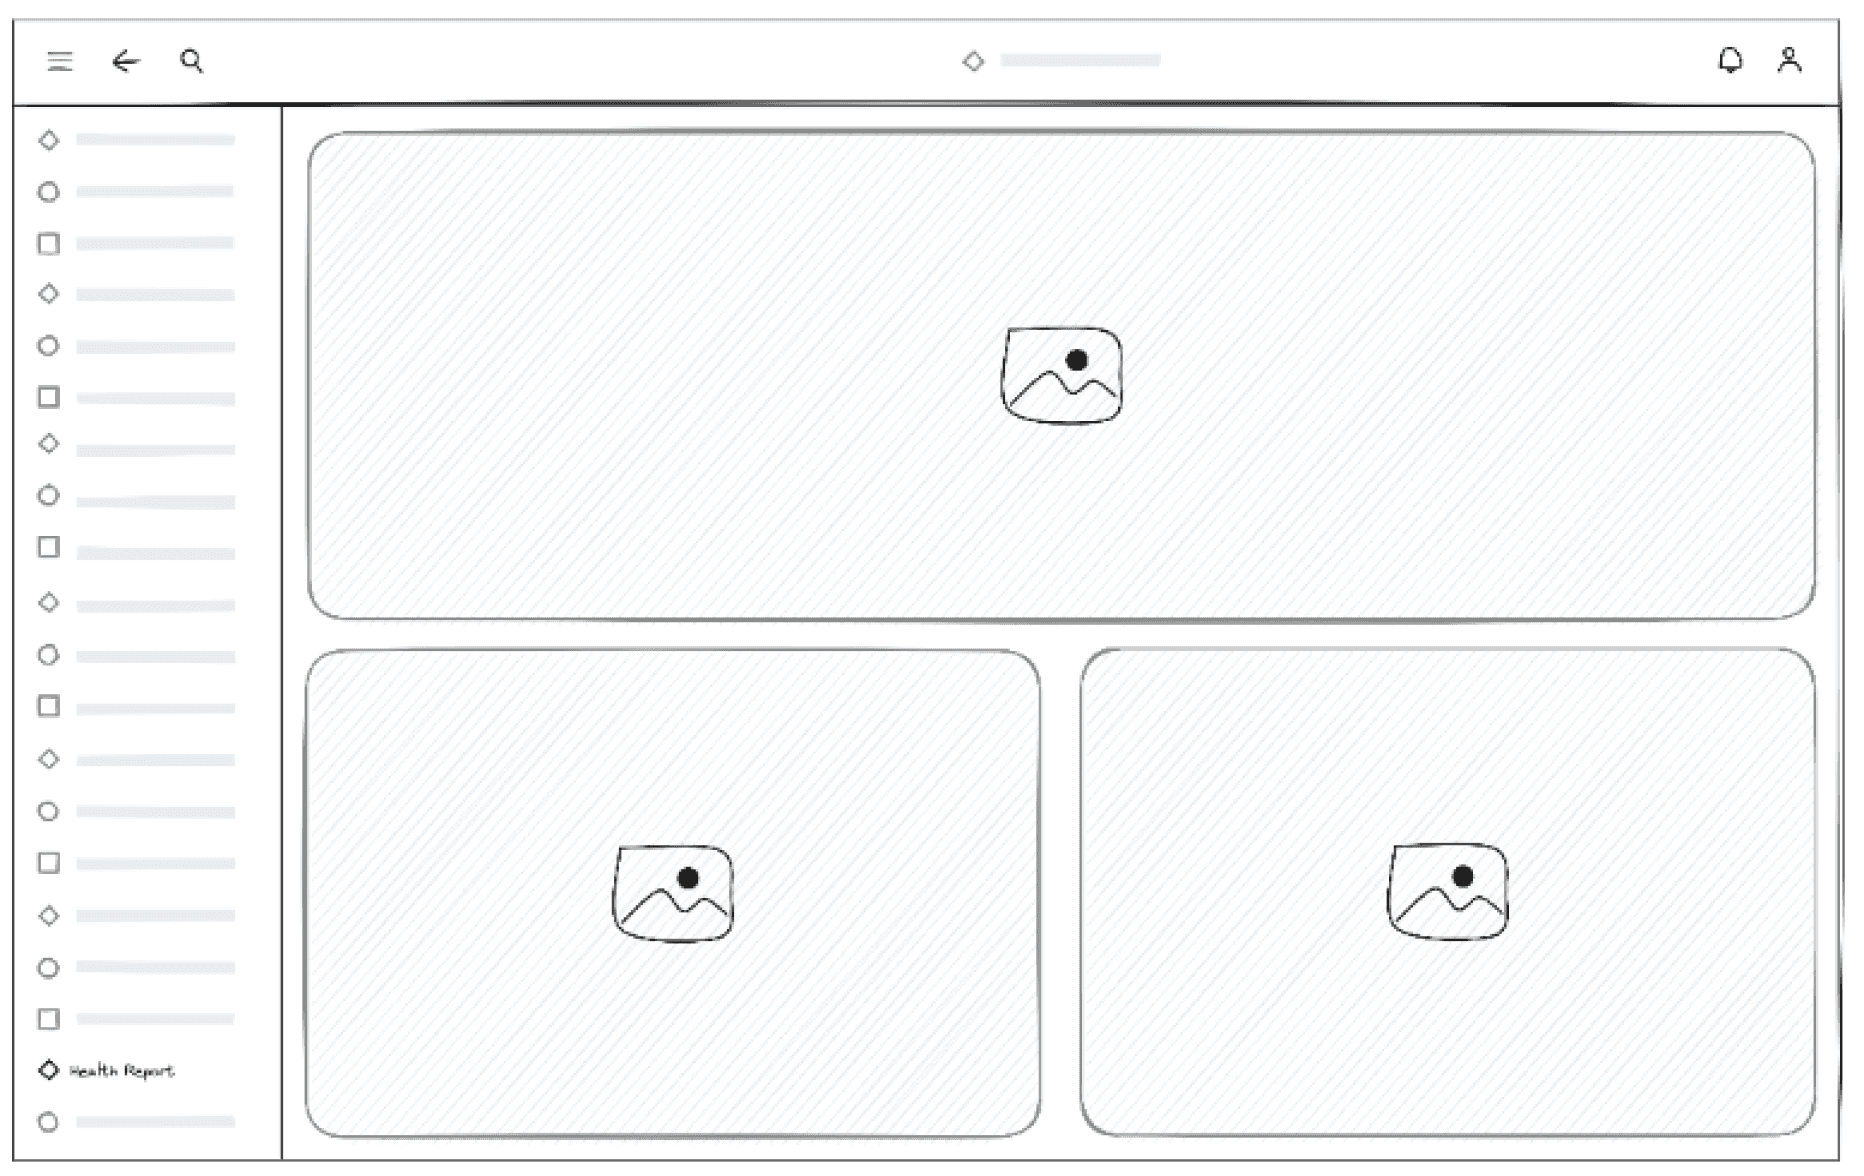
Step 1
Workspace Navigation
Select 'Platform Health Report'
workspace from the side navigation bar

Step 2
Platform Health Dashboard
The self-diagnosing dashboard shows diagnosis information for the last 15 minutes by default. Click on the diagnosis tiles to update the values in the table below.
Step 2
Platform Health Dashboard
The self-diagnosing dashboard shows diagnosis information for the last 15 minutes by default. Click on the diagnosis tiles to update the values in the table below.
Step 1
Select 'Platform Health Report'
workspace from the side navigation bar
Workspace Navigation
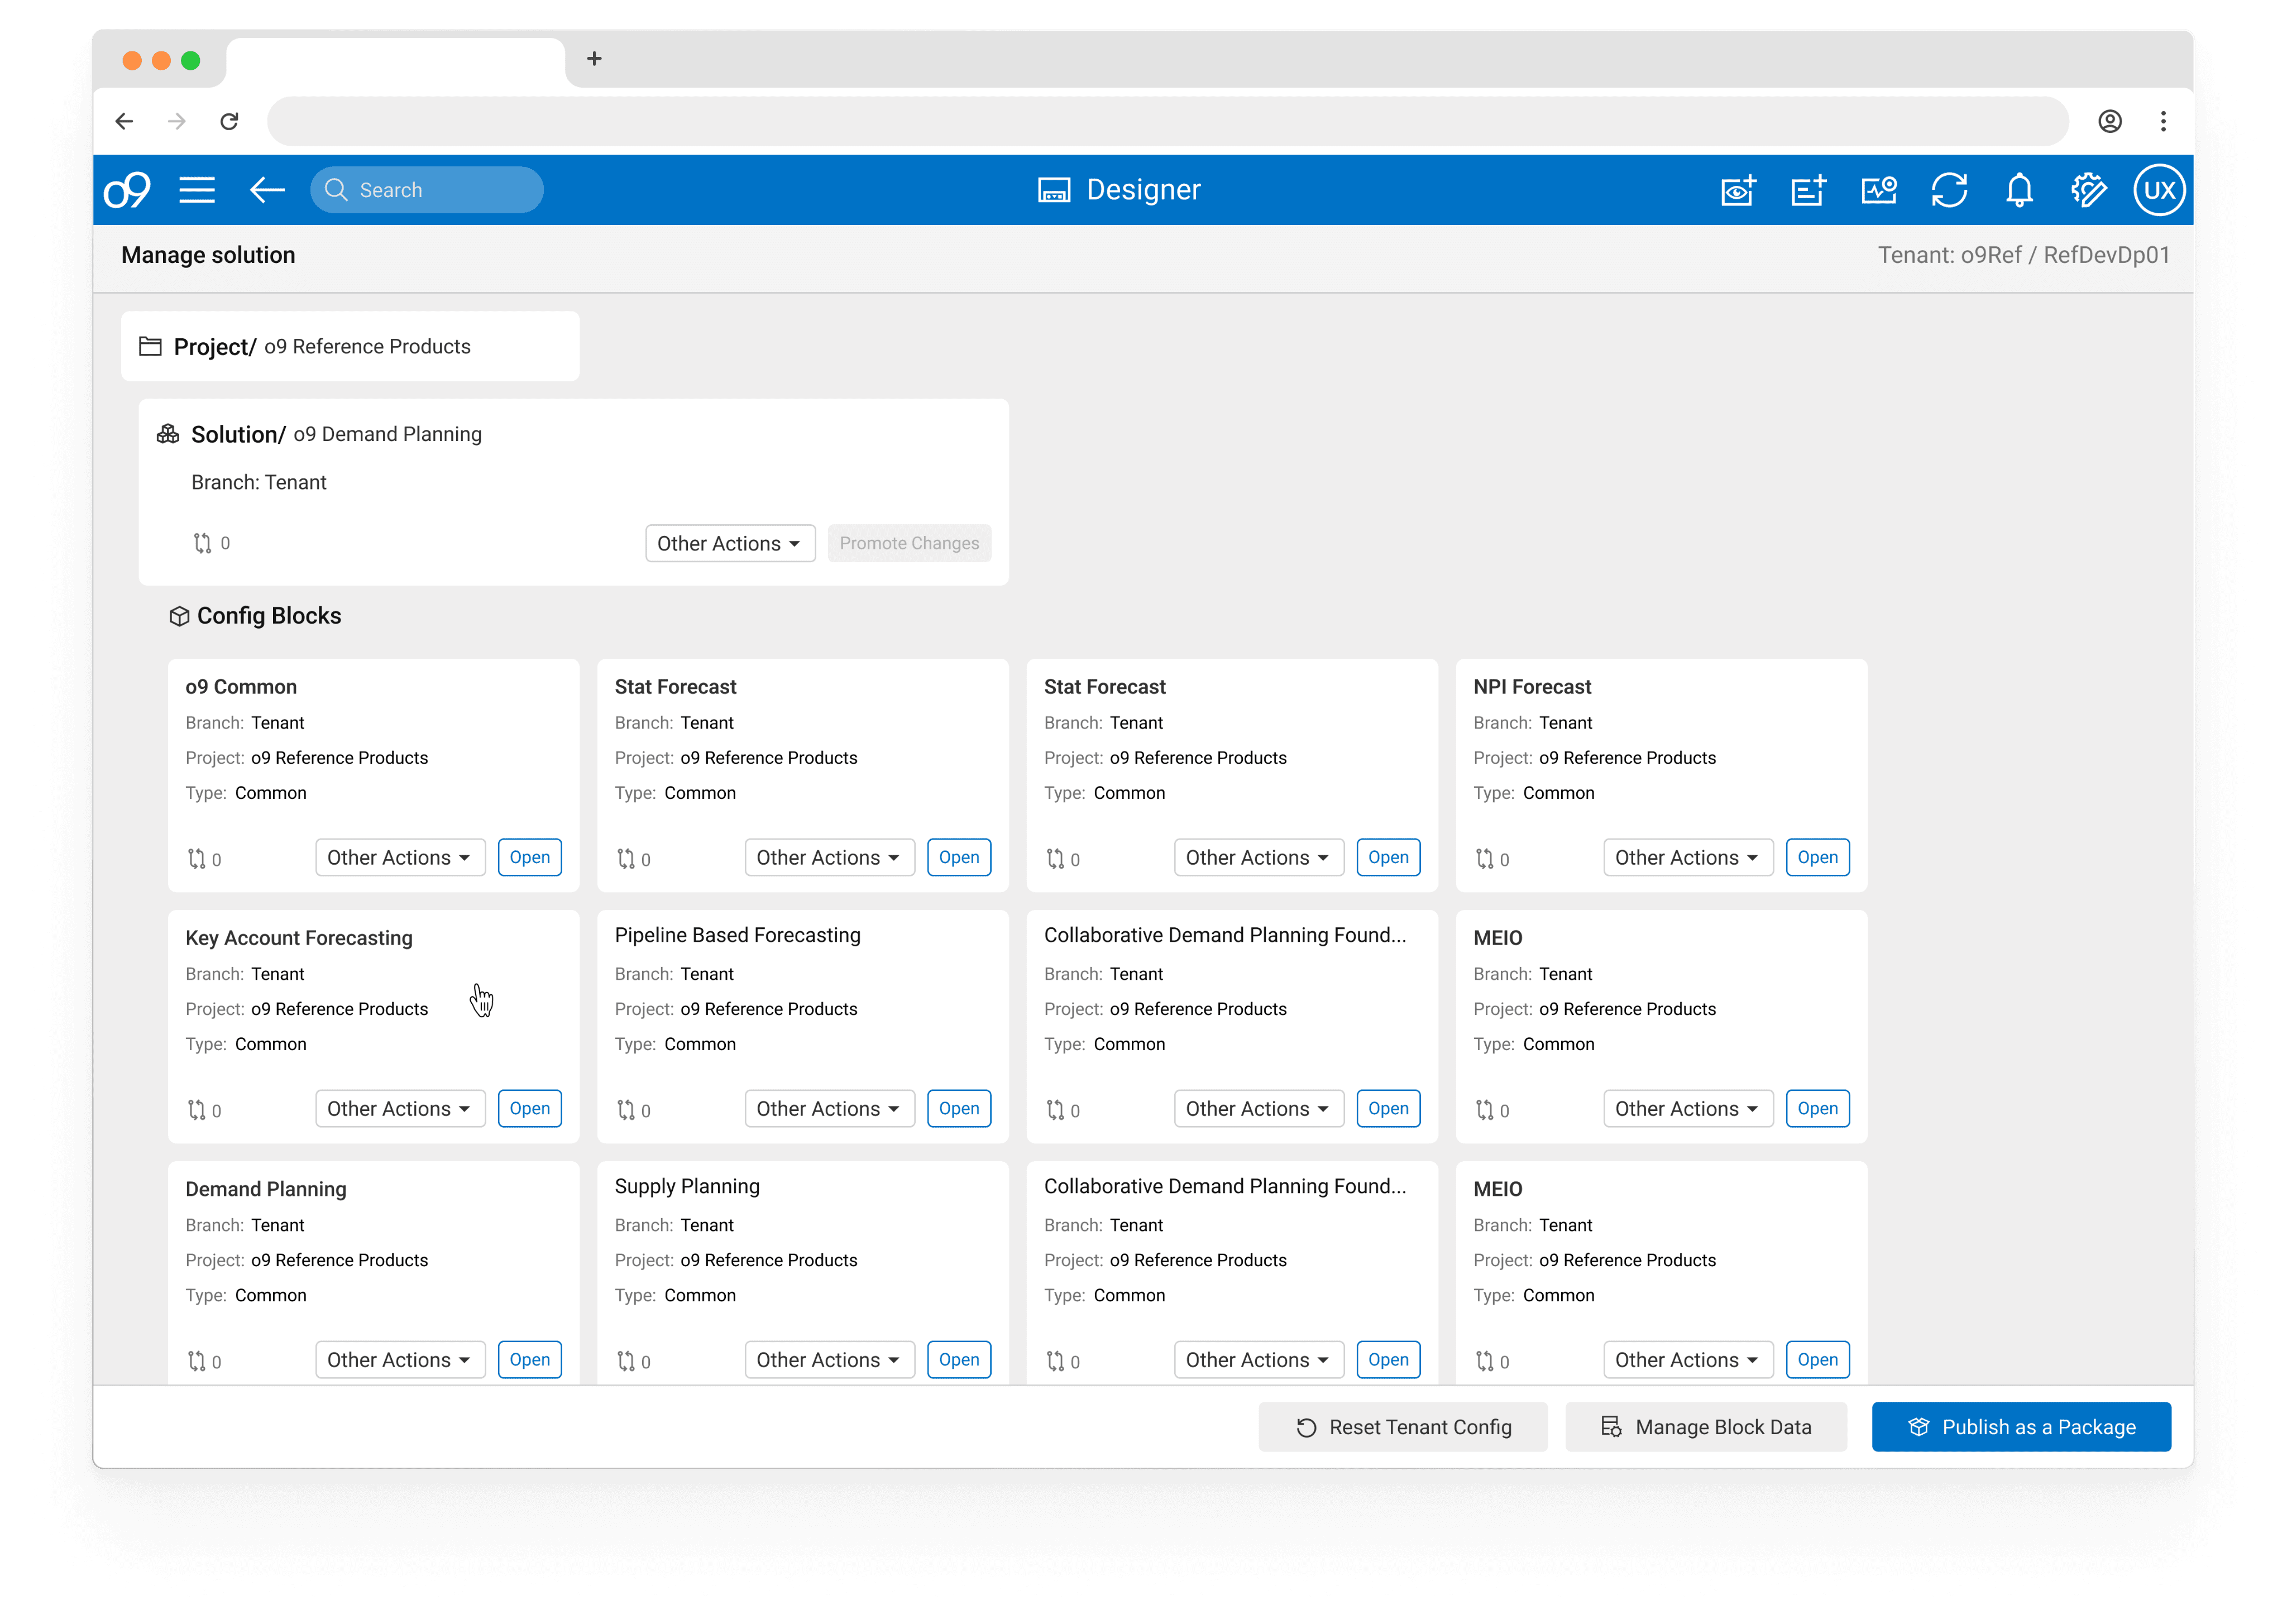
Iterations & Final Designs
Show Labels
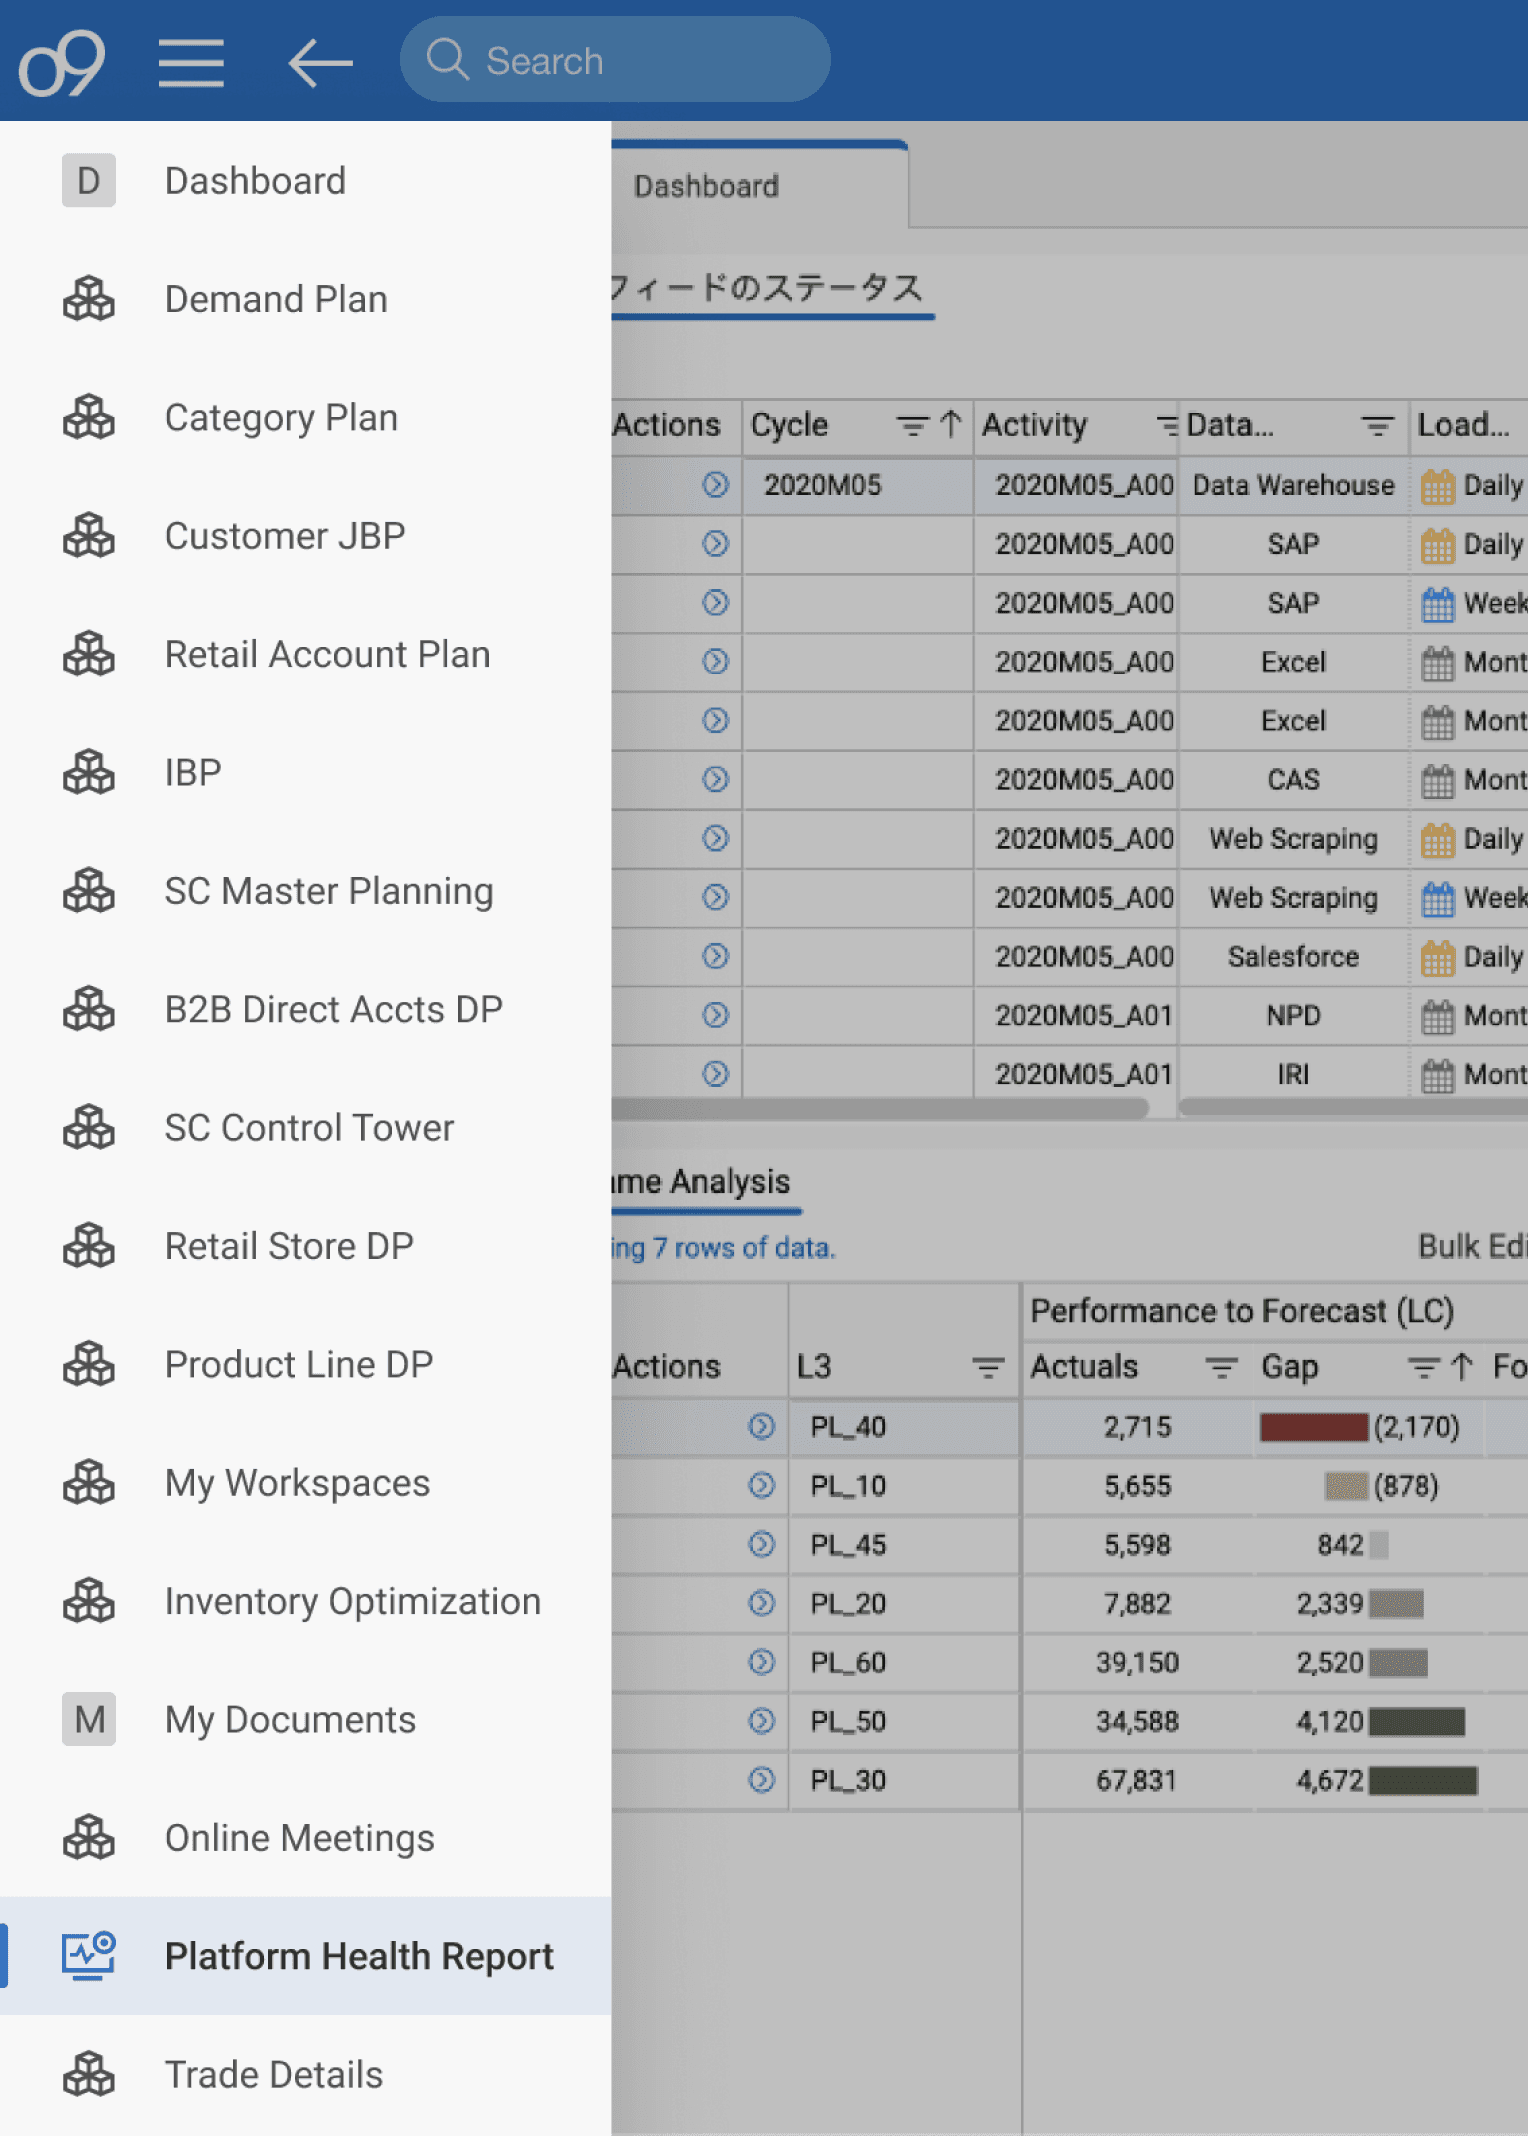
Consistent find-ability for new workspcae
Navigation
User experiences are optimized by utilizing existing mental models that users are familiar with. This approach allows users to focus on their tasks without needing to learn new models.
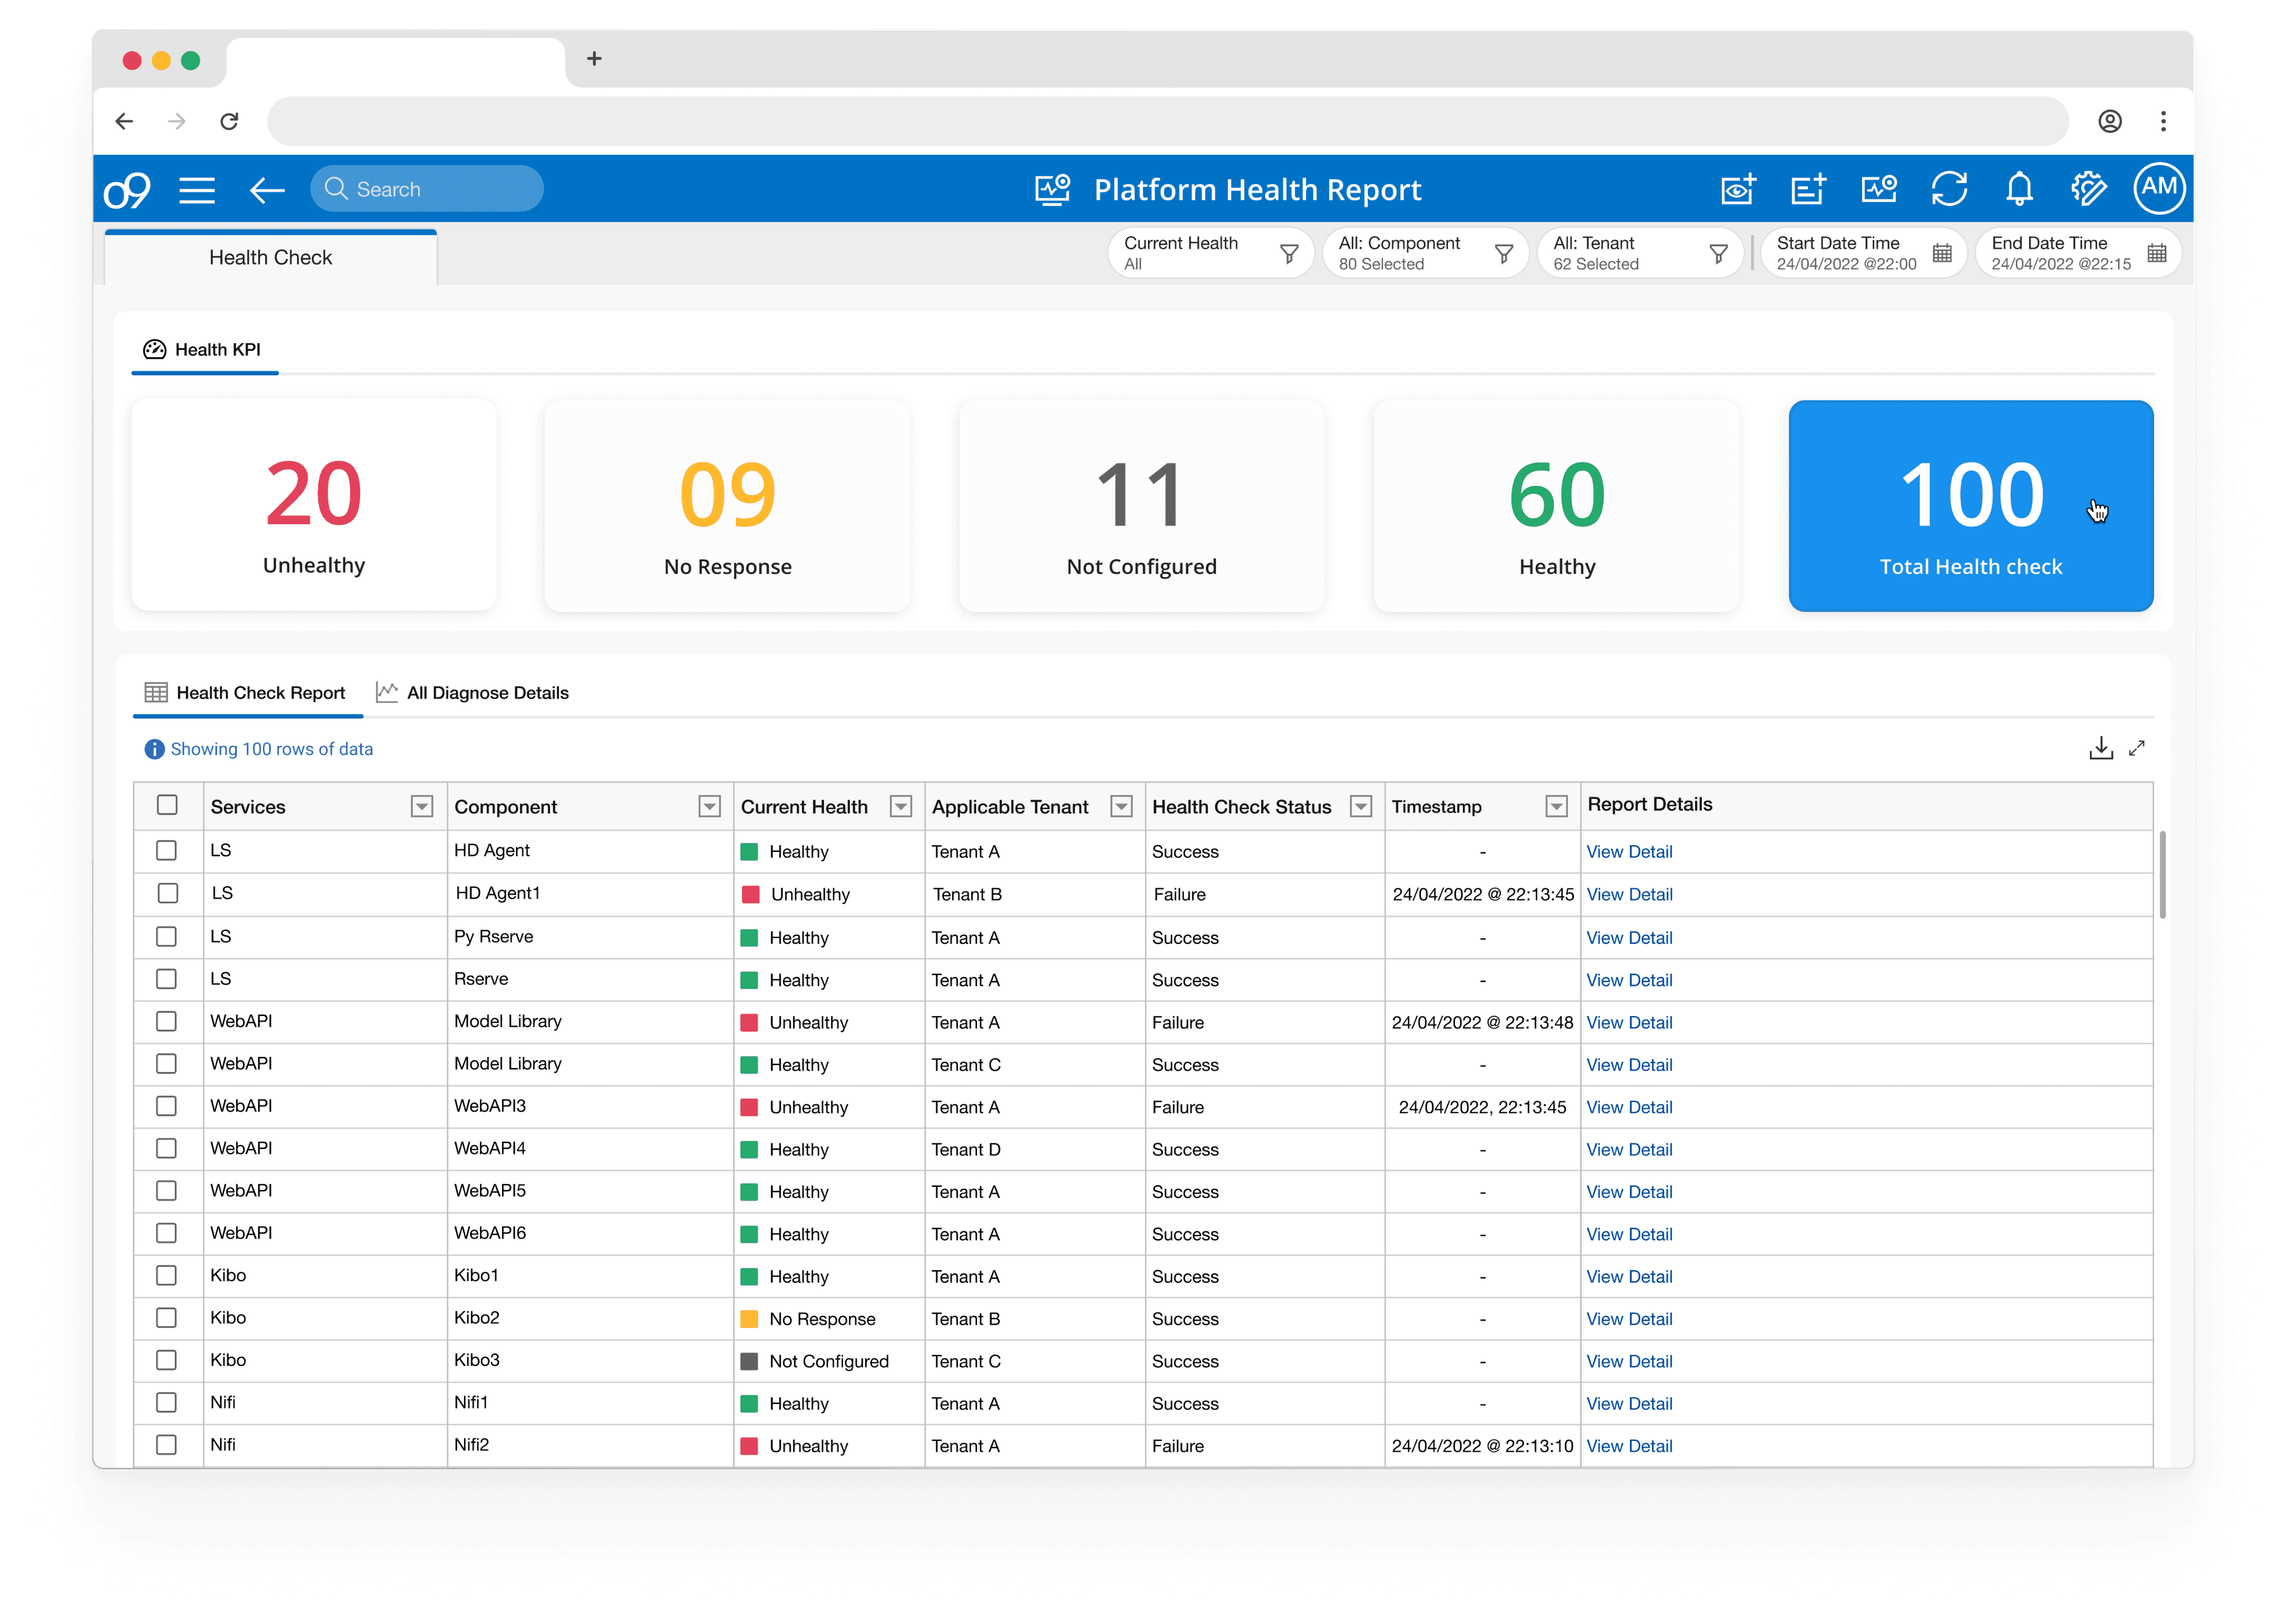
KPI values tiles give a quick summarised view of the platform health report
Interactive health check report showing synced data with the KPI tile selected above
Report actions: download & enlarge view
Dashboard View
Simplifying the data for users who just want an overview of the platform health
Interactive KPI tiles synchronized with the report view below, providing an easier and quicker way to filter the view without applying filters.
Expand and collapse all action on Report details columns might help users
Too many filters might confuse the new users,

Report details are collapsed by default to not overwhelm the user with information
Tabs Navigation
The majority of users requested an overview of the platform's status and whether the environment was operational. The cause of the failure is not crucial for everyone, except for specific roles, as all the report details are initially hidden.lt.
Manual click to see each report details in this view.
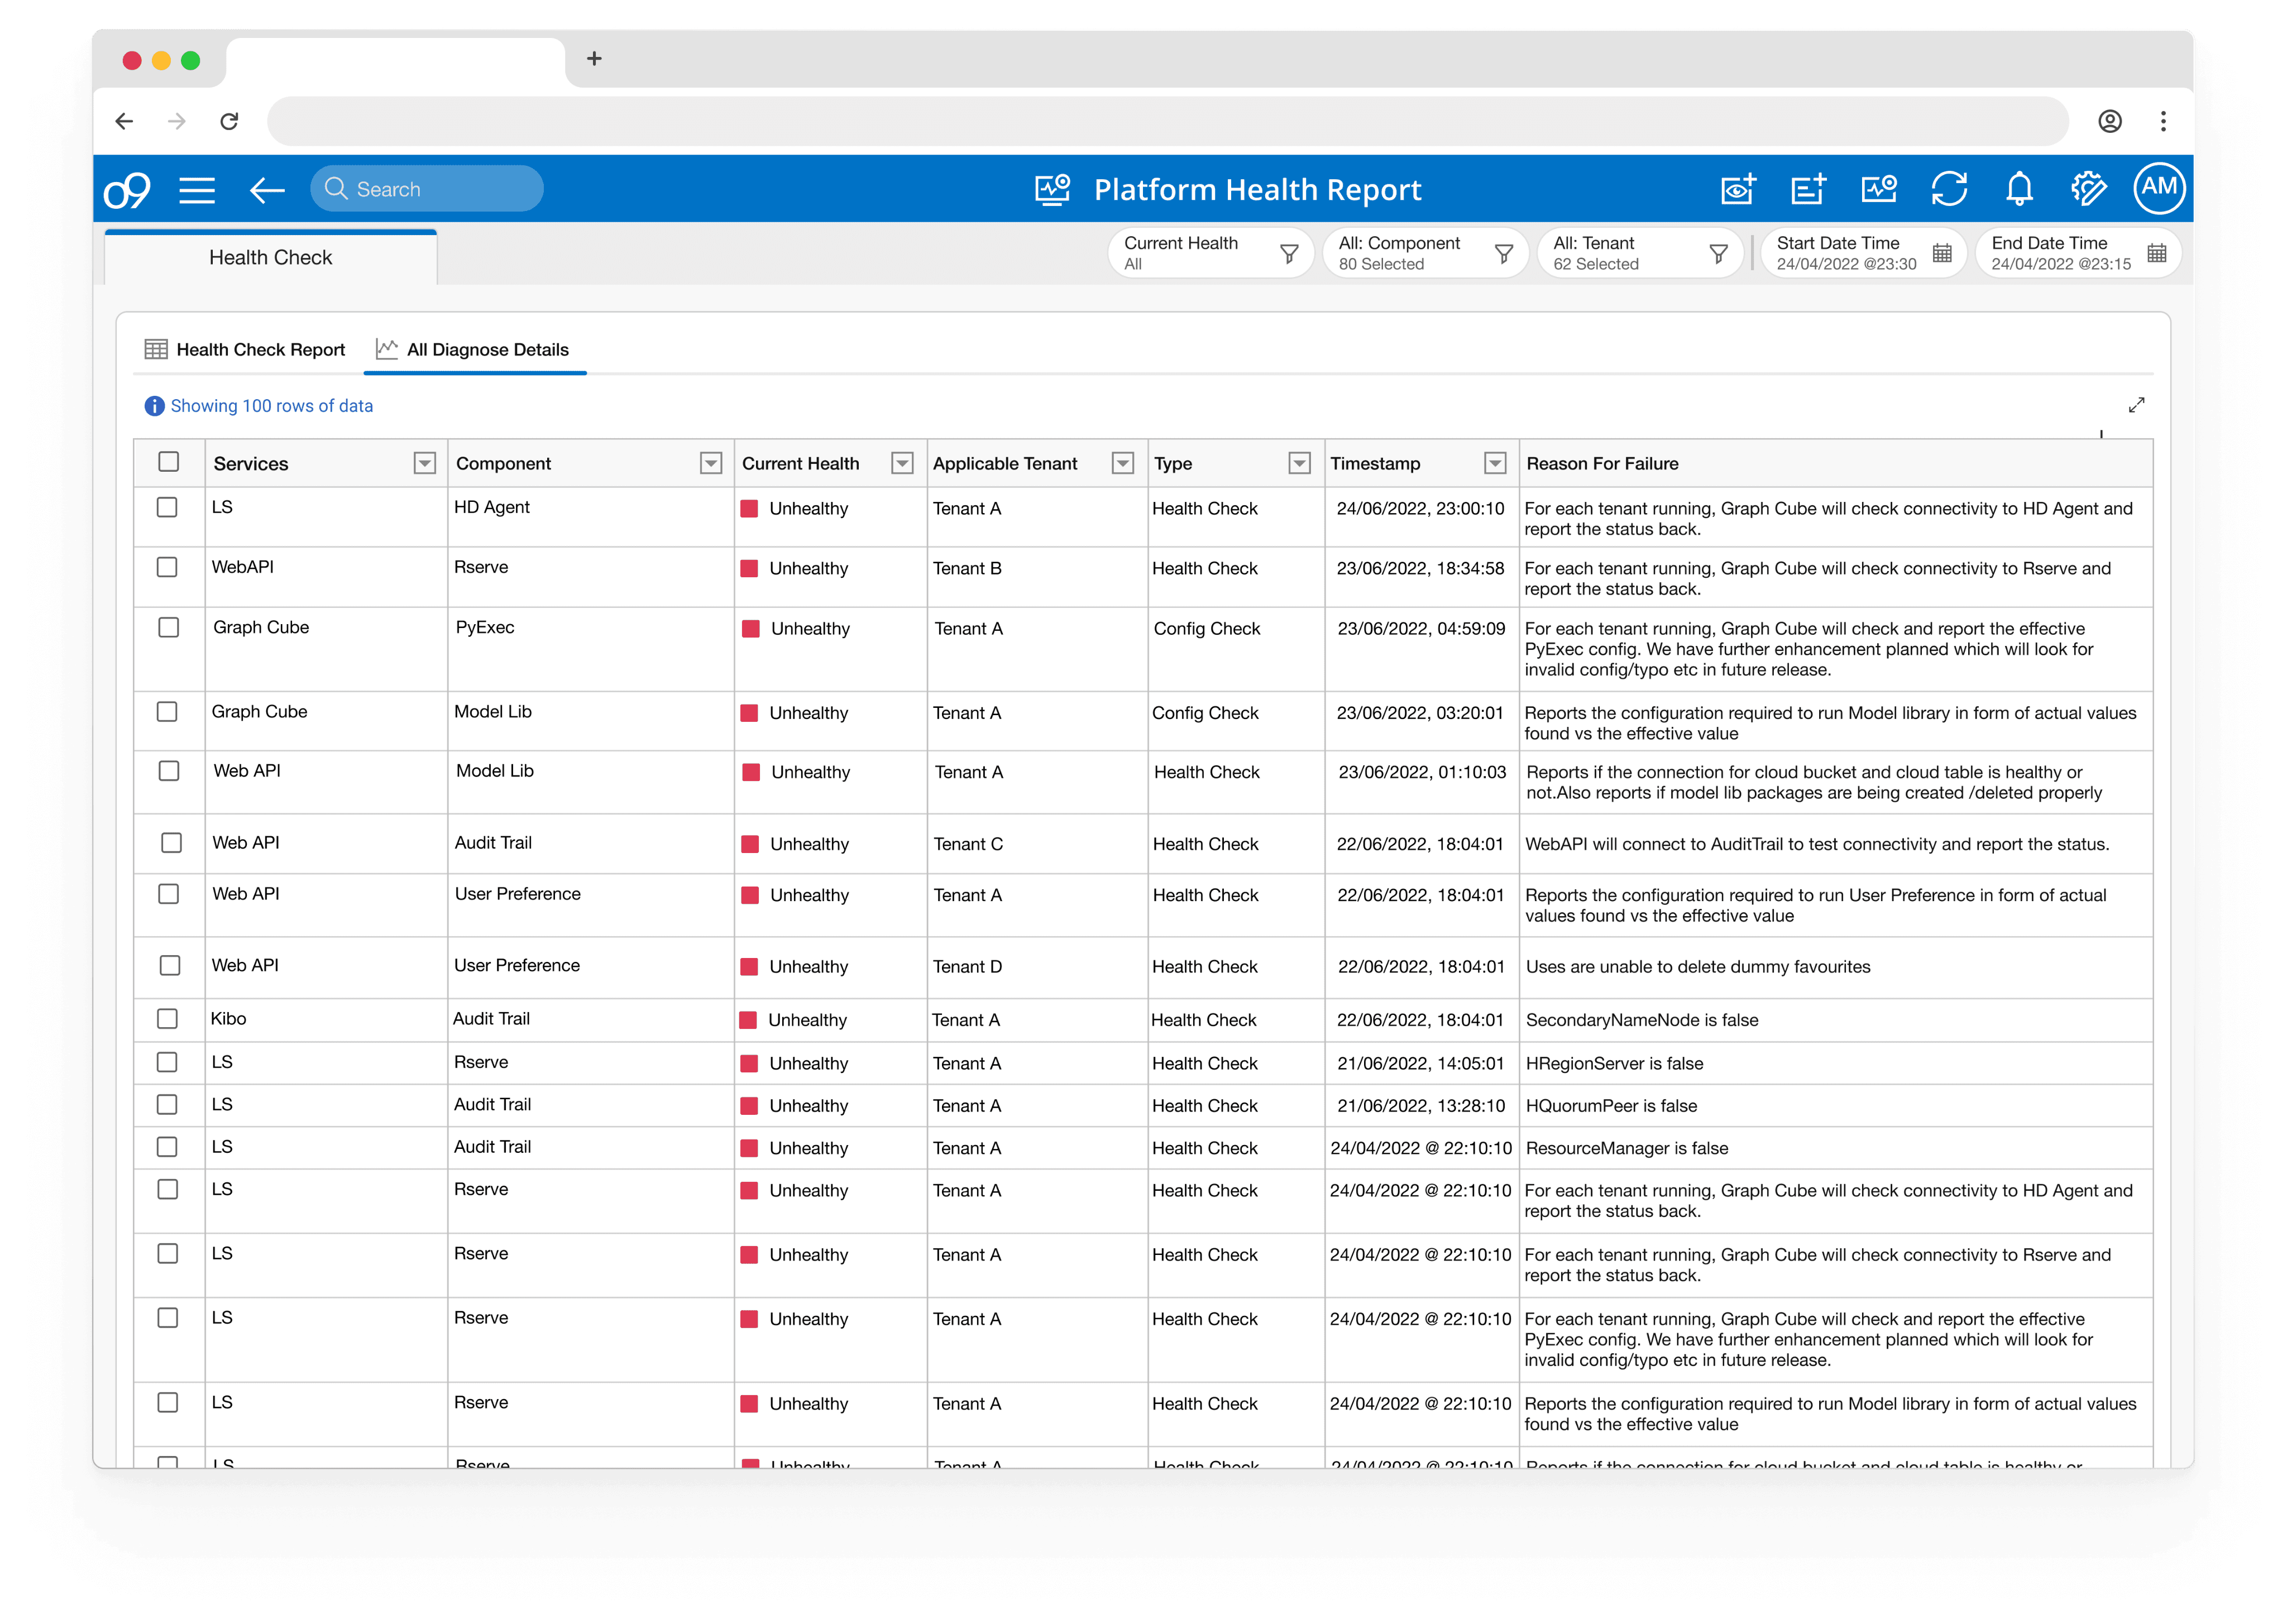
Other tab is specially focused on providing the reasons for failure to the user with other details
Details View
This diagnose details tab is relevant to specific roles focusing on finding the reasons for failure and to help them resolving the issue.
The user (System architect) cannot directly assign the issue to the team from here or track the progress.
Video Loop
Interactive KPI Tiles with relevant information show a quick view of the platform's overall health.
Detailed diagnosis information is also available if required.
Iterations & Final Designs
Show Labels
Consistent find-ability for new workspcae
Navigation
User experiences are optimized by utilizing existing mental models that users are familiar with. This approach allows users to focus on their tasks without needing to learn new models.
KPI values tiles give a quick summarised view of the platform health report
Interactive health check report showing synced data with the KPI tile selected above
Report actions: download & enlarge view
Dashboard View
Simplifying the data for users who just want an overview of the platform health
Interactive KPI tiles synchronized with the report view below, providing an easier and quicker way to filter the view without applying filters.
Expand and collapse all action on Report details columns might help users
Too many filters might confuse the new users,
Report details are collapsed by default to not overwhelm the user with information
Tabs Navigation
The majority of users requested an overview of the platform's status and whether the environment was operational. The cause of the failure is not crucial for everyone, except for specific roles, as all the report details are initially hidden.lt.
Manual click to see each report details in this view.
Other tab is specially focused on providing the reasons for failure to the user with other details
Details View
This diagnose details tab is relevant to specific roles focusing on finding the reasons for failure and to help them resolving the issue.
The user (System architect) cannot directly assign the issue to the team from here or track the progress.
Video Loop
Interactive KPI Tiles with relevant information show a quick view of the platform's overall health.
Detailed diagnosis information is also available if required.
Iterations & Final Designs
Step 2
Select 'Platform Health Report'
workspace from the side navigation bar
Workspace Navigation
Step 1
Select 'Platform Health Report'
workspace from the side navigation bar
Workspace Navigation
Step 2
Select 'Platform Health Report'
workspace from the side navigation bar
Workspace Navigation

Step 1
Select 'Platform Health Report'
workspace from the side navigation bar
Workspace Navigation

Step 1
Select 'Platform Health Report'
workspace from the side navigation bar
Workspace Navigation
I tried to keep the design aesthetics synced with the company's design language
I tried to keep the design aesthetics synced with the company's design language
I tried to keep the design aesthetics synced with the company's design language
I tried to keep the design aesthetics synced with the company's design language


More Projects
Next
92%
It is critical in enabling users to monitor the health of the environments, swiftly diagnose issues & maintain overall system stability and reliability.
Participants wanted 'system health data access'
>80
Agreed that there is
Lack of visibility
42%
Environment
System Admin
35%
Project Manger
23%
Executives
The categorization and number of participants involved in the survey facilitated the creation of focused personas later on.
>65
Users got affected by delayed information about the environment diagnosis & resolution
Component-specific insights
76%
Users agreed to the importance in allowing users to quickly identify & resolve issues. To ensures smooth project progress and identify & resolves issues quickly.
>57
Post-upgrade stability check
This will ensure system updates do not disrupt operations, enabling system administrators to maintain reliability and quickly address any arising issues.
23%
Executives
37%
Environment Admins
22%
Devops Team
13%
Development Team
5%
Project Team
User type response
Total number of user responses received across cross-functional departments